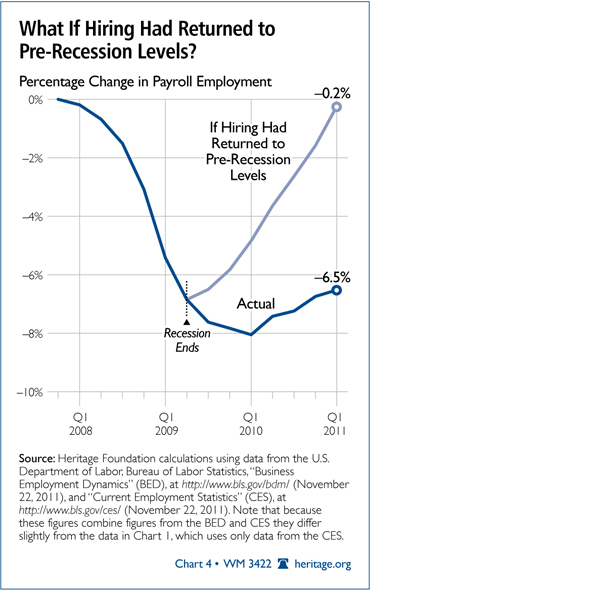
In a new paper, Heritage’s James Sherk explains that unemployment remains high because job creation has fallen. In the following chart, you can see how private-sector employment would have changed if job creation returned to pre-recession levels in June 2009. (Article continued below infographic.)

Unfortunately, the economic picture today isn’t as bright as it is in the above alternate reality. Sherk lays out the numbers behind the poor job growth.
From the recession’s onset to the first quarter of 2009, private job creation fell by 24 percent to 5.8 million jobs. That was the lowest quarterly job creation on record. Since then, job creation has only slightly recovered. In the first quarter of 2011, employers created just 6.3 million new jobs—1.3 million fewer jobs than in the quarters before the recession began.
Fewer existing businesses are expanding, while fewer entrepreneurs are starting new businesses. In the first quarter of 2011, the number of workers hired in new business establishments fell to just 660,000, 27 percent fewer than when the recession began. This is the lowest number of workers hired at new businesses that the Bureau of Labor statistics has ever recorded—lower even than the worst points of the recession.
The drop in hiring at new businesses has occurred because entrepreneurs are starting fewer enterprises and because they are hiring fewer workers per new enterprise. The average number of workers hired at new establishments fell to 3.6 per business in Q1 2011, also the lowest on record.
No comments:
Post a Comment